A few days back, I shared a plot that showed World’s Top 10 richest folks using Wikipedia data.
I used Plotly Python to create the plot. Here is the snippet:
# full_nodeset is the set of nodes (person, country, company name)
# source is the list of items that are used as source (start to draw from here)
# target is the list of items that are used as target (stop to draw here)
# values is the list of numeric values to determine the flow
# colorlist is the list of colors for each source-target connection
# Sankey Plot
fig = go.Figure(data=[go.Sankey(
node = dict(
pad = 15,
thickness = 20,
label = [f"{name}: ${find_networth(name)}B" for name in list(full_nodeset.values())],
color = colorlist
),
link = dict(
source = source,
target = target,
value = values
))])
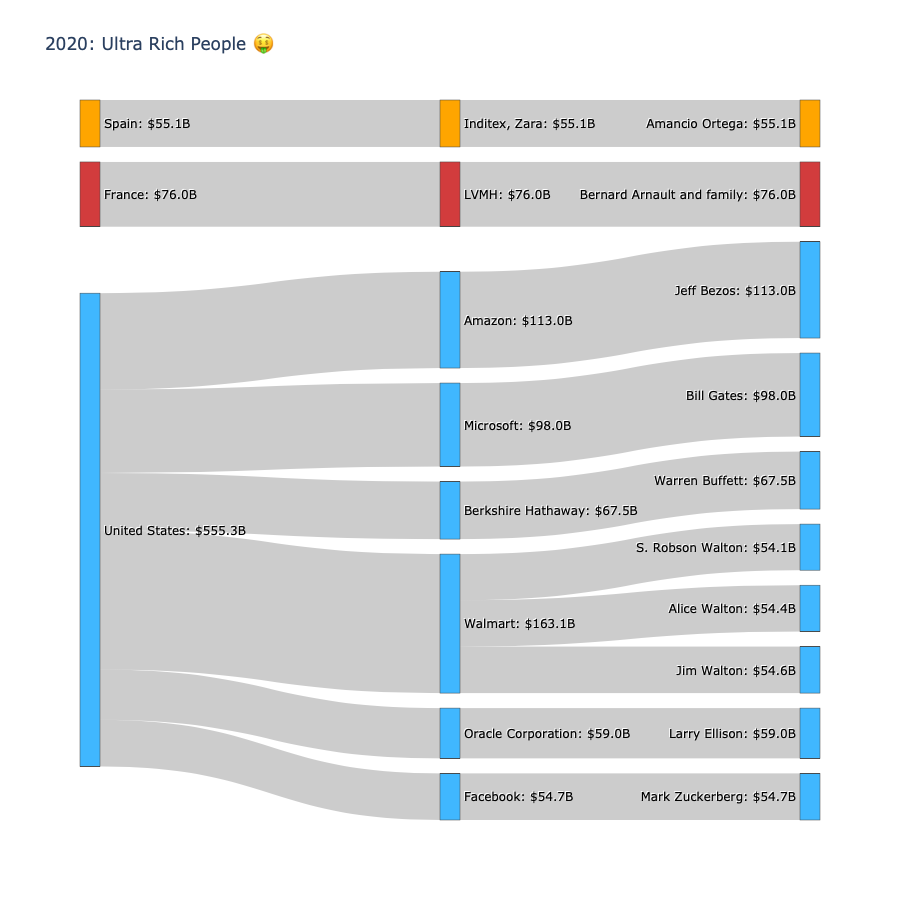
fig.update_layout(title_text="2020: Ultra Rich People 🤑", font_size=12, width=900, height=900)
fig.show()
Let’s print out the data to help visualise how its being used by Sankey.
for src, tgt, val, clr in zip(
    [find_name(full_nodeset, idx) for idx in source],
    [find_name(full_nodeset, idx) for idx in target],
    values,
    colorlist
):
    print(f"{src} -> {tgt} -> {val} :: {clr}")
This is the output.
France -> LVMH -> 76.0 :: #40b7ff
Spain -> Inditex, Zara -> 55.099998474121094 :: #d23c3d
United States -> Amazon -> 113.0 :: #40b7ff
United States -> Berkshire Hathaway -> 67.5 :: #ffa500
United States -> Facebook -> 54.70000076293945 :: #40b7ff
United States -> Microsoft -> 98.0 :: #40b7ff
United States -> Oracle Corporation -> 59.0 :: #40b7ff
United States -> Walmart -> 163.10000610351562 :: #40b7ff
LVMH -> Bernard Arnault and family -> 76.0 :: #40b7ff
Inditex, Zara -> Amancio Ortega -> 55.099998474121094 :: #ffa500
Amazon -> Jeff Bezos -> 113.0 :: #d23c3d
Berkshire Hathaway -> Warren Buffett -> 67.5 :: #ffa500
Facebook -> Mark Zuckerberg -> 54.70000076293945 :: #40b7ff
Microsoft -> Bill Gates -> 98.0 :: #d23c3d
Oracle Corporation -> Larry Ellison -> 59.0 :: #40b7ff
Walmart -> Alice Walton -> 54.400001525878906 :: #40b7ff
Walmart -> Jim Walton -> 54.599998474121094 :: #40b7ff
Walmart -> S. Robson Walton -> 54.099998474121094 :: #40b7ff
Wealth Over the Years
One bubble seems to get bigger each year since 2015 😃
alt.Chart(allDf).mark_circle(
    opacity=0.8,
    stroke='black',
    strokeWidth=1,
#     fill="purple"
).encode(
    alt.X("year", title="Year"),
    alt.Y("Name", title="💰💰 Ultra rich folks 💰💰"),
    alt.Size("networth", title="Networth (USD, Billion)"),
#     alt.Color("networth"),
    alt.Tooltip(["Name", "year", "networth", "Source(s) of wealth"]),
    color=alt.condition(alt.datum.networth >= 100, alt.value("orange"), alt.value("steelblue")),
).properties(
    width=500,
    height=800
)
And this is the snapshot of the allDf dataframe
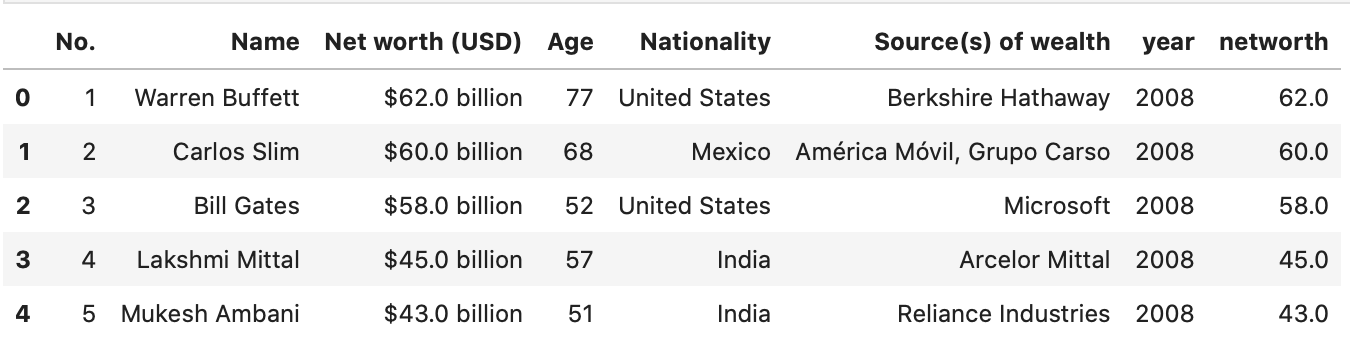
Update: 01 Dec 2020
By the way, a lot has changed since then.
Mr Musk has made a grand entry to the list and TSLA shorts 🩳, oh well.